BSI Reports 2018 – 2020

BSI is the UK’s national standards body, helping organisations in 182 countries embed excellence into the way people and products work.

Since 2016 I’ve worked with BSI through FUGU PR to design a series of international reports based on existing branding guidelines.

BSI requested that the branding for the 2018 reports be further developed and extended, and I worked with the client to establish a consistent illustration style and new cover design template. All elements needed to be clear, concise and sympathetic to the message of each brochure.

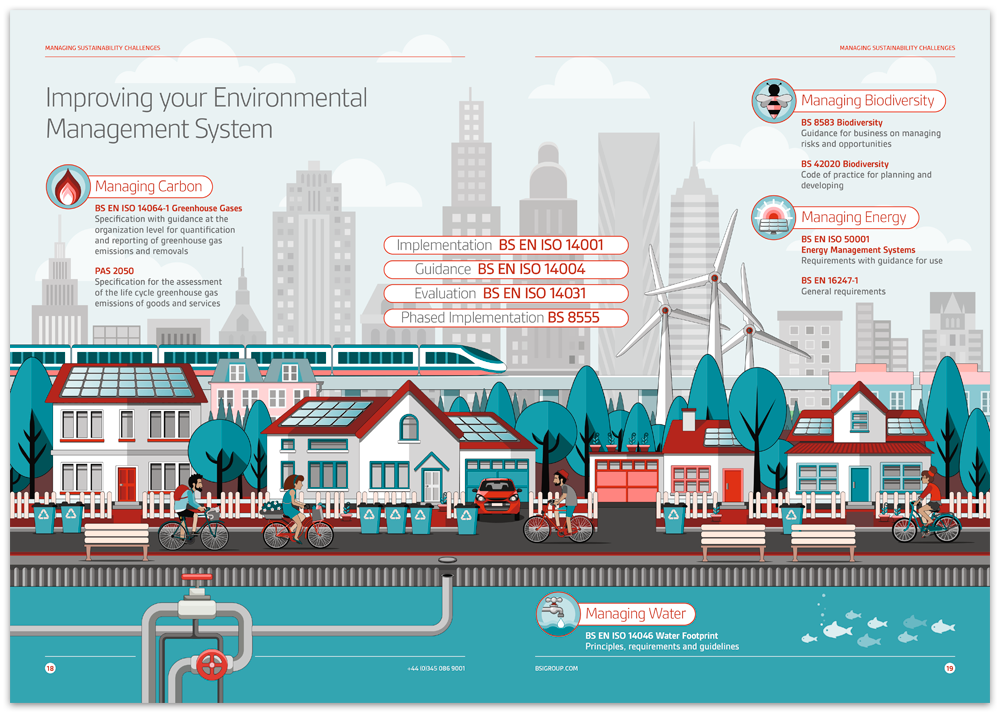
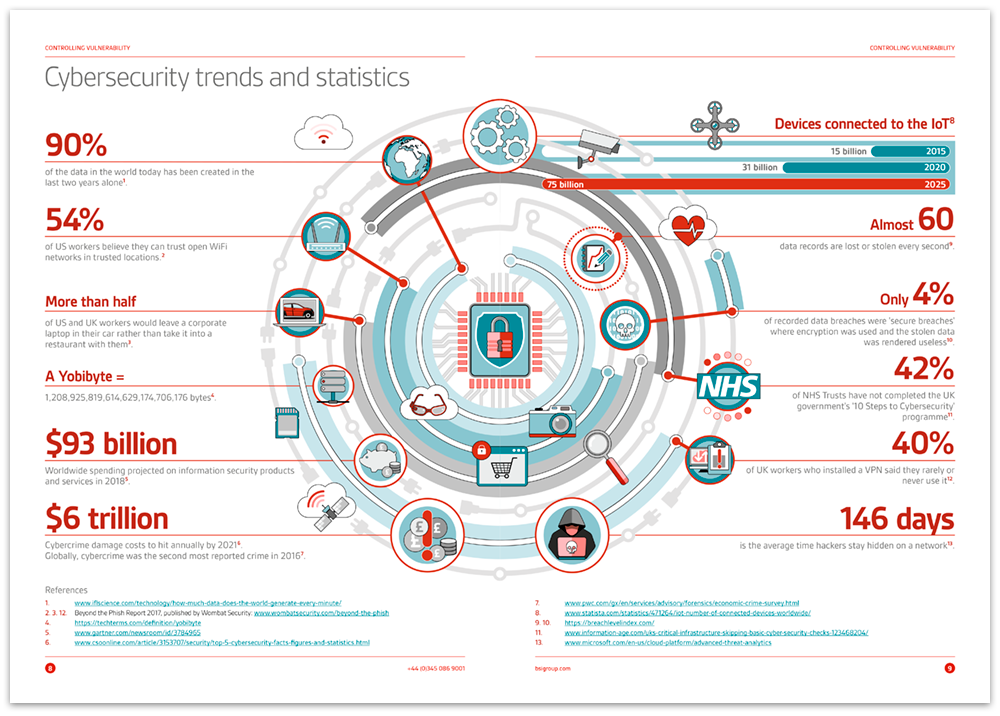
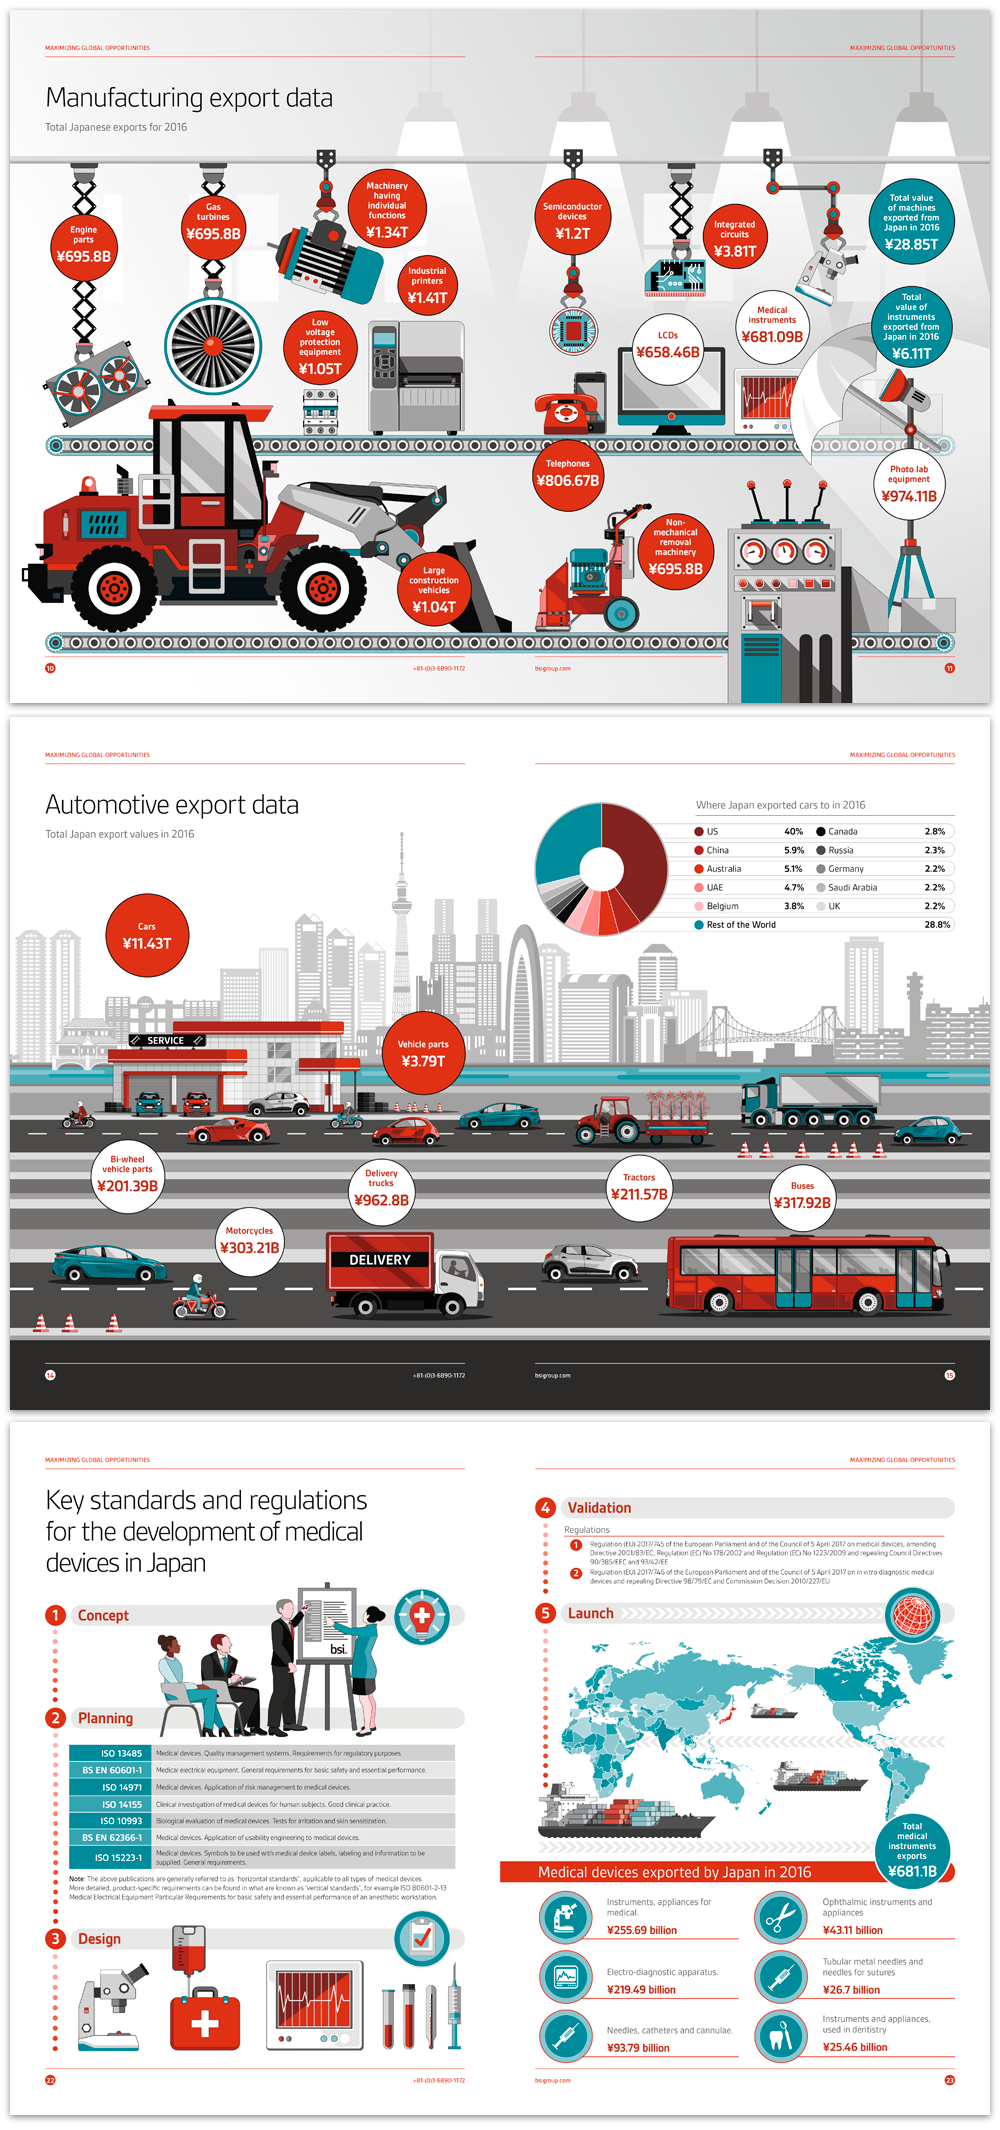
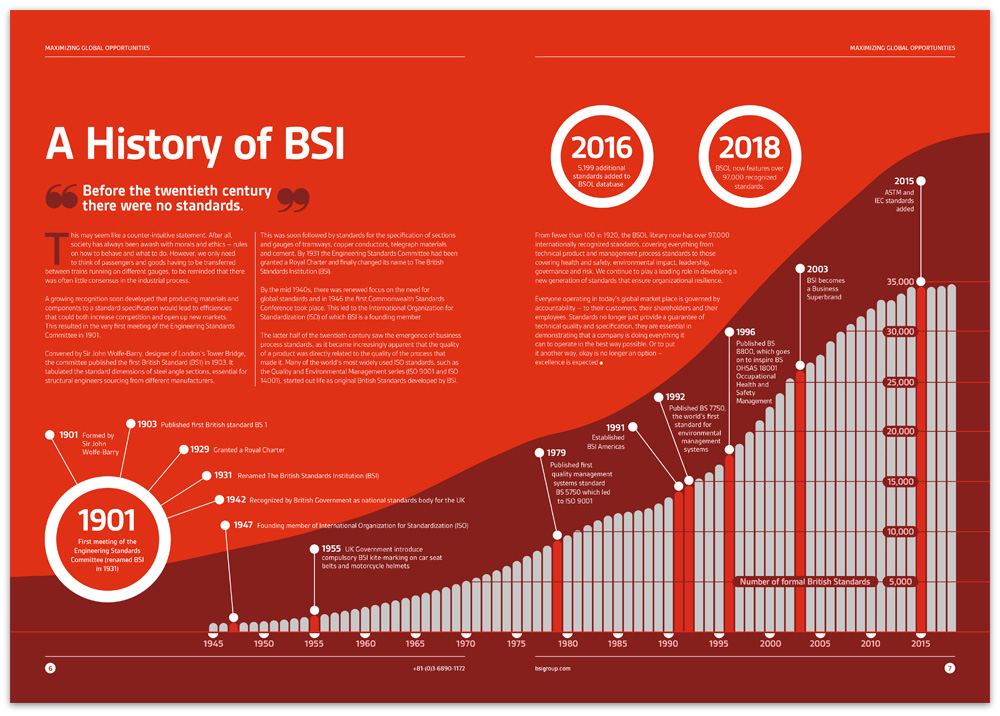
Each report references key economic trends and technologies, relevant to the region or industry in question. I provided layout, illustrated infographics, iconography and image research and aquisition in print and digital versions, as well as reusable assets for future projects.

digital | illustration | infographics | print
It's always a pleasure to work with Anthony. He really understands how to deliver within budget and to the required timescales. Anthony's experience and practical attitude has been invaluable when solving design challenges to keep projects moving.
Ben Crispin, Fugu PR
An illustrative infographic for the BSI Sustainability Report. I needed to show how an interconnected city improves sustainability in a balanced and easily readable manner.
The infographic for the BSI Cybersecurity Report was based upon a multi-layered pie chart, which I then recomposited to fit within an illustrative, connective display. Iconographic elements displayed elsewhere in the brochure were then added with corresponding statistics to pull it all together.
The full set of icons for the BSI Cybersecurity Report. As well as being consistent as a group as well as to the new illustrative style, icons had to be easy to read, exude character and also be faithful to existing iconography conventions.
The three illustrative infographics for the BSI's International Report for Japan are based on my designs for the Brazil and USA brochures from 2016-2017. I applied the updated illustrative style that I'd pinned down with the client, creating improved consistency and connection throughout the publication. You can also download a Japanese translation.
A simple bar chart can be visually appealing as well as designed so that it becomes a recognisable and repurposable image, used in several of the BSI reports and slightly repurposed each time.

Interested in working together?